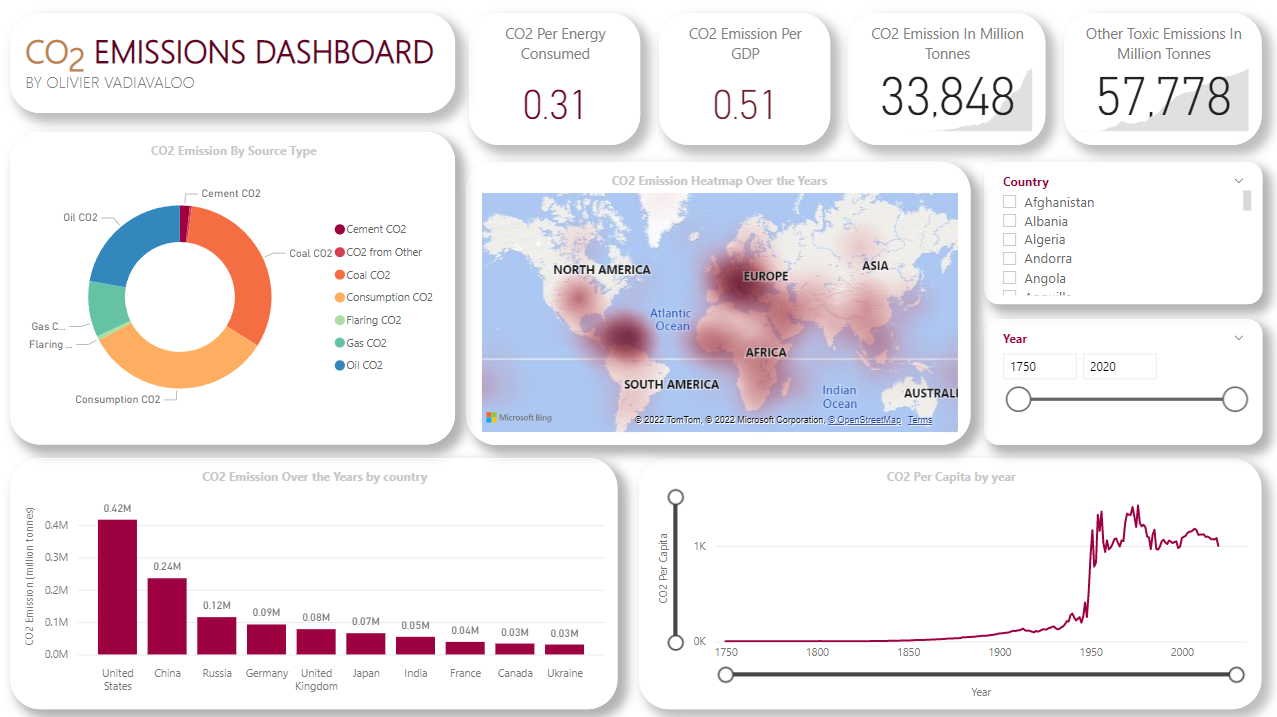
CO2 & GHG Emissions Data Analysis

Technologies used: SQL Server (T-SQL), Excel, Power BI
Dashboard File: bike_sales_dashboard.pbix
Dataset: BikeSales-DB.xlsx
T-SQL Queries: Bike_Sales_Queries_1.sql
Github: bikesales-Queries
Biking is a fun activity. It is also enormously enjoyed as a means of commuting in countries such as the Netherlands. The associated equipment can be grouped into roughly three categories: accessories, clothing and obviously, bikes. Which category drives sales for biking equipment? How do equipment sales fluctuate within a year? How do sales vary by country?
In this project, I analyse a fictional dataset (source: Kaggle Datasets) about bike sales. The dataset is comprised of information such as order details, product names, revenue, profit and customers' age and gender. After cleaning the data in Microsoft Excel and examining it using T-SQL queries, I created a dashboard (see above) in Microsoft Power BI to visualize and summarize its important aspects, such as the sum of profit, sum of revenue, the revenue by country and the like.
See the full list of queries here.
Input:
SELECT Product_Category, SUM(Profit) AS [Net Revenue]
FROM BikeSalesDB..bike_sales
GROUP BY Product_Category| Product Category | Net Revenue (USD) |
| Clothing | 2839319 |
| Bikes | 20399726 |
| Accessories | 8807194 |
• Bikes seem to be the biggest source of revenue. 🤔
Input:
WITH sum_units_sold_coun_cat AS (
	SELECT Country, SUM(Order_Quantity) AS Total_Sold
	FROM BikeSalesDB..bike_sales
	GROUP BY Country
)
SELECT bsales.Country, bsales.Product_Category,
		ROUND(SUM(bsales.Order_Quantity) / coun_cat.Total_Sold, 5) AS [Perc of Units Sold]
FROM BikeSalesDB..bike_sales bsales INNER JOIN
		sum_units_sold_coun_cat coun_cat
		ON bsales.Country = coun_cat.Country
GROUP BY bsales.Country, bsales.Product_Category, coun_cat.Total_Sold
ORDER BY 1, 2
Output:
| Country | Product Category | Perc of Units Sold (%) |
| Australia | Accessories | 0.76857 |
| Australia | Bikes | 0.03871 |
| Australia | Clothing | 0.19273 |
| Canada | Accessories | 0.79823 |
| Canada | Bikes | 0.01175 |
| Canada | Clothing | 0.19002 |
| France | Accessories | 0.7845 |
| France | Bikes | 0.02977 |
| France | Clothing | 0.18573 |
| Germany | Accessories | 0.78332 |
| Germany | Bikes | 0.0334 |
| Germany | Clothing | 0.18328 |
| United Kingdom | Accessories | 0.77653 |
| United Kingdom | Bikes | 0.03074 |
| United Kingdom | Clothing | 0.19273 |
| United States | Accessories | 0.78332 |
| United States | Bikes | 0.02341 |
| United States | Clothing | 0.19328 |
• Items from the "Accessories" category are the most sold items in every country - as expected. 🤷
• Bikes constitue less than 10% of sales in every country.
Input:
WITH product_rev_by_age AS (
	SELECT Age_Group, Product, SUM(Revenue) AS Revenue
	FROM BikeSalesDB..bike_sales
	GROUP BY Age_Group, Product
),
top_three_prod AS (
	SELECT Age_Group, Product, Revenue,
			RANK() OVER (PARTITION BY Age_Group ORDER BY Revenue DESC) Rev_Rank
	FROM product_rev_by_age
)
SELECT Age_Group AS [Age Group],
		Product,
		Rev_Rank AS [Revenue Rank],
		Revenue
FROM top_three_prod
WHERE Rev_Rank < 4
Output:
| Age Group | Product | Revenue Rank | Revenue (USD) |
| Adults (35-64) | Road-150 Red, 52 | 1 | 1707275 |
| Adults (35-64) | Mountain-200 Silver, 42 | 2 | 1596139 |
| Adults (35-64) | Mountain-200 Black, 42 | 3 | 1579925 |
| Seniors (64+) | Mountain-100 Black, 48 | 1 | 19845 |
| Seniors (64+) | Sport-100 Helmet, Blue | 2 | 18501 |
| Seniors (64+) | Sport-100 Helmet, Black | 3 | 14456 |
| Young Adults (25-34) | Road-150 Red, 62 | 1 | 1859098 |
| Young Adults (25-34) | Mountain-200 Black, 38 | 2 | 1687197 |
| Young Adults (25-34) | Road-150 Red, 56 | 3 | 1249804 |
| Youth (<25) | Road-150 Red, 62 | 1 | 602455 |
| Youth (<25) | Mountain-200 Silver, 42 | 2 | 583389 |
| Youth (<25) | Road-150 Red, 48 | 3 | 562870 |
• The Road-150 Red is present in the top 3 for all age groups, except for "Seniors (64+)".
Sadiq Shah. 2020. Bike Sales in Europe, Version 1. [Online Resource]
I generally reply to email inquiries within 3-5 business days. The best time to reach me by phone is between 11am and 5pm during weekdays. Feel free to leave a message on my voicemail if I'm temporarily unreachable via phone call.
CO2 & GHG Emissions Data Analysis

Indeed Job Web Scraping

Fictional Bike Sales Data Analysis
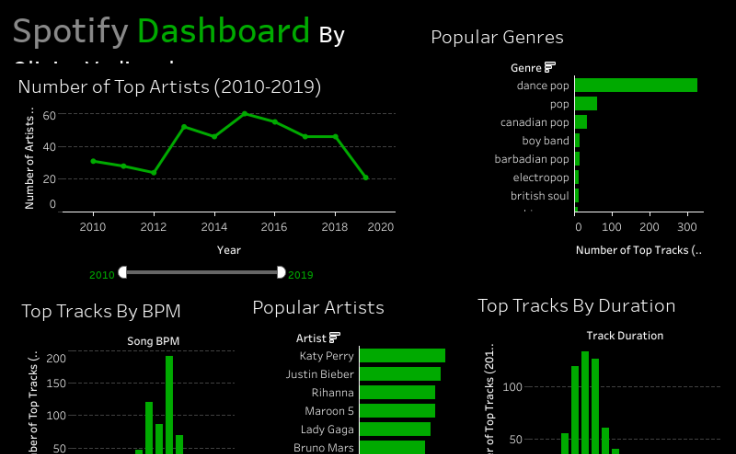
Top Spotify Tracks Data Analysis