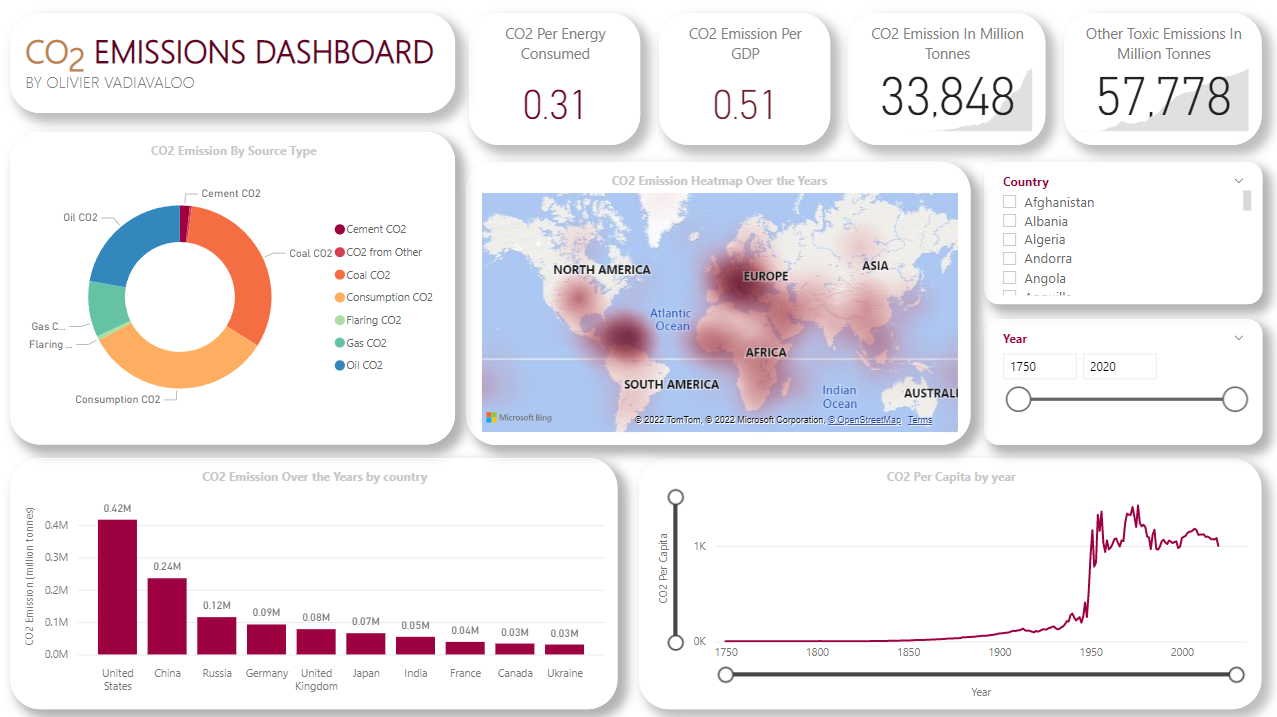
CO2 & GHG Emissions Data Analysis

Technologies used: SQL Server (T-SQL), Excel, Power BI
Dashboard File: Video_Game_Sales.pbix
Dataset: VideoGameSales-DB.xls
T-SQL Queries: Video_Game_Sales_Queries.sql
Github: video-game-sales
The video game industry is a billion-dollar industry. Both the PC gaming market and the mobile gaming market generate billions in revenue each year and they will very likely continue on this trend with the increasingly frequent improvements in the technology behind the development of video games.
In this project, I analyse a dataset (source: Kaggle Datasets) about video game sales. After writing several T-SQL queries to examine the data and answer, I created a dashboard ( see above) in Microsoft Power BI to visualize and summarize some of its important aspects.
See the full list of queries here.
Input:
WITH max_by_year AS (
	SELECT [Year], MAX(vg2.[Global_Sales]) AS [Max_Sales]
	FROM VideoGameSales..vgsales vg2
	GROUP BY [Year]
)
SELECT vg1.[Year],
	   vg1.[Name] AS [Top-Selling Video Game],
	   vg1.[Platform],
	   vg1.[Global_Sales] AS [Copies sold in millions]
FROM VideoGameSales..vgsales vg1 INNER JOIN
	 max_by_year mby ON
	 mby.[Year] = vg1.[Year] AND
	 mby.[Max_Sales] = vg1.[Global_Sales]
ORDER BY vg1.[Year]| Year | Top-Selling Video Game | Platform | Copies sold in millions |
| 1980 | Asteroids | 2600 | 4.31 |
| 1981 | Pitfall! | 2600 | 4.5 |
| 1982 | Pac-Man | 2600 | 7.81 |
| 1983 | Baseball | NES | 3.2 |
| 1984 | Duck Hunt | NES | 28.31 |
| 1985 | Super Mario Bros. | NES | 40.24 |
| 1986 | The Legend of Zelda | NES | 6.51 |
| 1987 | Zelda II: The Adventure of Link | NES | 4.38 |
| 1988 | Super Mario Bros. 3 | NES | 17.28 |
| 1989 | Tetris | GB | 30.26 |
| 1990 | Super Mario World | SNES | 20.61 |
| 1991 | The Legend of Zelda: A Link to the Past | SNES | 4.61 |
| 1992 | Super Mario Land 2: 6 Golden Coins | GB | 11.18 |
| 1993 | Super Mario All-Stars | SNES | 10.55 |
| 1994 | Donkey Kong Country | SNES | 9.3 |
| 1995 | Donkey Kong Country 2: Diddy's Kong Quest | SNES | 5.15 |
| 1996 | Pokemon Red/Pokemon Blue | GB | 31.37 |
| 1997 | Gran Turismo | PS | 10.95 |
| 1998 | Pokémon Yellow: Special Pikachu Edition | GB | 14.64 |
| 1999 | Pokemon Gold/Pokemon Silver | GB | 23.1 |
| 2000 | Pokémon Crystal Version | GB | 6.39 |
| 2001 | Gran Turismo 3: A-Spec | PS2 | 14.98 |
| 2002 | Grand Theft Auto: Vice City | PS2 | 16.15 |
| 2003 | Need for Speed Underground | PS2 | 7.2 |
| 2004 | Grand Theft Auto: San Andreas | PS2 | 20.81 |
| 2005 | Nintendogs | DS | 24.76 |
| 2006 | Wii Sports | Wii | 82.74 |
| 2007 | Wii Fit | Wii | 22.72 |
| 2008 | Mario Kart Wii | Wii | 35.82 |
| 2009 | Wii Sports Resort | Wii | 33 |
| 2010 | Kinect Adventures! | X360 | 21.82 |
| 2011 | Call of Duty: Modern Warfare 3 | X360 | 14.76 |
| 2012 | Call of Duty: Black Ops II | PS3 | 14.03 |
| 2013 | Grand Theft Auto V | PS3 | 21.4 |
| 2014 | Grand Theft Auto V | PS4 | 11.98 |
| 2015 | Call of Duty: Black Ops 3 | PS4 | 14.24 |
| 2016 | FIFA 17 | PS4 | 4.77 |
| 2017 | Phantasy Star Online 2 Episode 4: Deluxe Package | PS4 | 0.03 |
| 2020 | Imagine: Makeup Artist | DS | 0.29 |
Input:
WITH sales_plat_yr AS (
	SELECT [Year], [Platform],
		   ROUND(SUM([Global_Sales]), 2) AS [Total_Sales]
	FROM VideoGameSales..vgsales
	WHERE [Year] >= 2000
	GROUP BY [Year], [Platform]
),
max_by_year AS (
	SELECT [Year], MAX([Total_Sales]) AS [Total_Sales]
	FROM sales_plat_yr
	GROUP BY [Year]
)
SELECT spy.[Year], spy.[Platform] AS [Top-Selling Platform],
	   spy.[Total_Sales] AS [Copies Sold in millions]
FROM sales_plat_yr spy INNER JOIN
	 max_by_year mby ON
	 mby.[Year] = spy.[Year] AND
	 mby.[Total_Sales] = spy.[Total_Sales]
ORDER BY 1
Output:
| Year | Top-Selling Platform | Copies Sold in millions |
| 2000 | PS | 96.28 |
| 2001 | PS2 | 166.43 |
| 2002 | PS2 | 205.4 |
| 2003 | PS2 | 184.29 |
| 2004 | PS2 | 211.78 |
| 2005 | PS2 | 160.65 |
| 2006 | Wii | 137.91 |
| 2007 | Wii | 154.97 |
| 2008 | Wii | 174.16 |
| 2009 | Wii | 210.44 |
| 2010 | X360 | 171.05 |
| 2011 | PS3 | 159.37 |
| 2012 | PS3 | 109.49 |
| 2013 | PS3 | 117.39 |
| 2014 | PS4 | 98.76 |
| 2015 | PS4 | 115.3 |
| 2016 | PS4 | 39.25 |
| 2017 | PS4 | 0.03 |
| 2020 | DS | 0.29 |
Input:
DECLARE @answer NVARCHAR(MAX), @sql NVARCHAR(MAX);
SET @answer = (
    SELECT STRING_AGG('['+t1.[Genre]+']', ',')
    FROM (
        SELECT DISTINCT CONVERT(NVARCHAR(MAX), [Genre]) AS [Genre]
        FROM VideoGameSales..vgsales
    ) t1
);

SET @sql = 'SELECT *
    FROM (
        SELECT [Genre],
                CONVERT(DECIMAL(9, 1), [Global_Sales]) AS [Global_Sales],
                [Year]
        FROM VideoGameSales..vgsales
    ) base
    PIVOT (
        SUM([Global_Sales])
        FOR Genre IN (
            ' + @answer + '
        )
    ) [pivot_t]
    WHERE [Year] IS NOT NULL
    ORDER BY [Year]';

EXEC(@sql);| Year | Puzzle | Shooter | Platform | Strategy | Misc | Adventure | Racing | Role-Playing | Fighting | Simulation | Action | Sports |
| 1980 | NULL | 7.1 | NULL | NULL | 2.7 | NULL | NULL | NULL | 0.8 | NULL | 0.3 | 0.5 |
| 1981 | 2.2 | 10.0 | 7.0 | NULL | NULL | NULL | 0.5 | NULL | NULL | 0.5 | 14.9 | 0.8 |
| 1982 | 10.0 | 3.8 | 5.0 | NULL | 0.9 | NULL | 1.6 | NULL | NULL | NULL | 6.4 | 1.1 |
| 1983 | 0.8 | 0.5 | 6.9 | NULL | 2.1 | 0.4 | NULL | NULL | NULL | NULL | 2.9 | 3.2 |
| 1984 | 3.1 | 31.1 | 0.7 | NULL | 1.4 | NULL | 6.0 | NULL | NULL | NULL | 1.9 | 6.2 |
| 1985 | 3.2 | 1.0 | 43.1 | NULL | NULL | NULL | NULL | NULL | 1.1 | 0.0 | 3.5 | 2.0 |
| 1986 | NULL | 4.0 | 9.4 | NULL | NULL | NULL | 2.0 | 2.5 | NULL | NULL | 13.6 | 5.6 |
| 1987 | NULL | 0.8 | 1.7 | NULL | NULL | 4.4 | NULL | 4.7 | 5.4 | NULL | 1.2 | 3.7 |
| 1988 | 5.6 | 0.5 | 27.8 | NULL | NULL | NULL | 2.1 | 6.0 | NULL | 0.0 | 1.7 | 3.6 |
| 1989 | 37.7 | 1.2 | 20.6 | NULL | 1.3 | NULL | NULL | 2.2 | NULL | NULL | 4.7 | 5.7 |
| 1990 | 5.9 | NULL | 23.0 | NULL | NULL | NULL | 6.3 | 4.5 | NULL | 1.1 | 6.4 | 2.1 |
| 1991 | 3.2 | 1.9 | 7.6 | 1.0 | 0.1 | 2.3 | 1.1 | 3.4 | 0.4 | 2.2 | 6.8 | 2.4 |
| 1992 | 4.8 | 0.2 | 13.3 | 0.4 | 5.0 | 12.3 | 9.1 | 7.0 | 15.4 | 2.1 | 3.8 | 3.0 |
| 1993 | 3.2 | 3.1 | 19.0 | 0.8 | 0.4 | 0.1 | 0.3 | 5.6 | 8.7 | 0.2 | 1.9 | 3.2 |
| 1994 | 1.5 | 8.4 | 28.8 | 3.6 | 3.0 | 3.8 | 2.4 | 7.1 | 8.5 | 2.8 | 1.5 | 8.5 |
| 1995 | 2.9 | 4.3 | 16.8 | 6.4 | 6.3 | 0.8 | 6.2 | 14.3 | 14.8 | 4.2 | 3.6 | 7.9 |
| 1996 | 3.7 | 7.1 | 28.3 | 5.7 | 10.5 | 4.1 | 28.4 | 43.9 | 18.0 | 11.4 | 20.4 | 17.6 |
| 1997 | 5.8 | 22.0 | 22.1 | 7.5 | 5.5 | 4.8 | 32.1 | 21.7 | 11.8 | 9.6 | 27.6 | 30.3 |
| 1998 | 6.3 | 9.9 | 29.7 | 13.5 | 12.1 | 9.0 | 28.0 | 28.2 | 31.9 | 7.2 | 39.3 | 42.6 |
| 1999 | 1.2 | 12.4 | 20.6 | 18.6 | 20.6 | 7.5 | 37.3 | 49.4 | 14.3 | 11.4 | 27.9 | 30.5 |
| 2000 | 3.7 | 6.9 | 16.1 | 8.5 | 15.6 | 3.1 | 20.3 | 29.1 | 20.1 | 3.5 | 34.1 | 41.6 |
| 2001 | 8.1 | 25.0 | 39.3 | 7.5 | 16.3 | 9.2 | 55.7 | 22.4 | 18.3 | 19.4 | 59.3 | 51.6 |
| 2002 | 5.6 | 48.3 | 46.3 | 5.7 | 15.8 | 11.2 | 30.5 | 45.5 | 25.0 | 10.9 | 86.8 | 65.3 |
| 2003 | 2.4 | 26.5 | 42.8 | 7.9 | 24.0 | 2.2 | 51.9 | 30.5 | 23.7 | 21.4 | 67.7 | 56.4 |
| 2004 | 8.5 | 46.9 | 46.7 | 7.5 | 31.3 | 8.6 | 47.9 | 54.0 | 16.8 | 10.9 | 76.4 | 64.0 |
| 2005 | 20.3 | 42.1 | 23.6 | 5.3 | 61.1 | 8.4 | 56.4 | 28.4 | 19.9 | 49.4 | 85.4 | 59.0 |
| 2006 | 10.8 | 38.1 | 49.8 | 4.1 | 67.2 | 11.1 | 33.9 | 57.5 | 22.6 | 21.3 | 66.6 | 135.8 |
| 2007 | 23.9 | 70.8 | 35.9 | 9.3 | 91.9 | 24.3 | 38.7 | 44.1 | 17.6 | 49.0 | 106.2 | 98.5 |
| 2008 | 15.5 | 59.5 | 36.2 | 11.8 | 86.7 | 24.7 | 70.6 | 59.6 | 35.8 | 46.5 | 137.0 | 95.6 |
| 2009 | 19.9 | 69.6 | 40.9 | 12.2 | 77.3 | 19.9 | 33.8 | 47.7 | 32.5 | 33.7 | 139.1 | 138.9 |
| 2010 | 11.1 | 77.6 | 32.0 | 13.4 | 96.7 | 15.6 | 34.9 | 69.4 | 15.1 | 22.4 | 118.1 | 92.4 |
| 2011 | 5.0 | 99.0 | 27.8 | 9.0 | 55.8 | 14.9 | 34.8 | 53.3 | 22.5 | 15.4 | 118.5 | 57.4 |
| 2012 | 1.7 | 73.0 | 18.4 | 3.2 | 22.9 | 5.6 | 14.4 | 48.3 | 9.4 | 13.5 | 121.3 | 31.1 |
| 2013 | 1.0 | 62.7 | 25.5 | 6.3 | 25.9 | 6.3 | 13.1 | 44.9 | 7.3 | 8.6 | 125.1 | 41.5 |
| 2014 | 1.5 | 66.0 | 8.9 | 1.1 | 23.6 | 5.7 | 16.7 | 45.9 | 16.3 | 5.5 | 99.3 | 46.6 |
| 2015 | 0.7 | 66.1 | 6.0 | 1.7 | 11.6 | 7.9 | 7.9 | 36.7 | 7.8 | 5.4 | 69.6 | 41.9 |
| 2016 | NULL | 18.0 | 2.1 | 0.4 | 0.9 | 1.4 | 1.6 | 6.6 | 3.9 | 0.3 | 18.9 | 14.6 |
| 2017 | NULL | NULL | NULL | NULL | NULL | NULL | NULL | 0.0 | NULL | NULL | 0.0 | NULL |
| 2020 | NULL | NULL | NULL | NULL | NULL | NULL | NULL | NULL | NULL | 0.3 | NULL | NULL |
Gregory Smith. 2018. Video Game Sales, Version 2. [Online Resource]
I generally reply to email inquiries within 3-5 business days. The best time to reach me by phone is between 11am and 5pm during weekdays. Feel free to leave a message on my voicemail if I'm temporarily unreachable via phone call.
CO2 & GHG Emissions Data Analysis

Indeed Job Web Scraping

Fictional Bike Sales Data Analysis
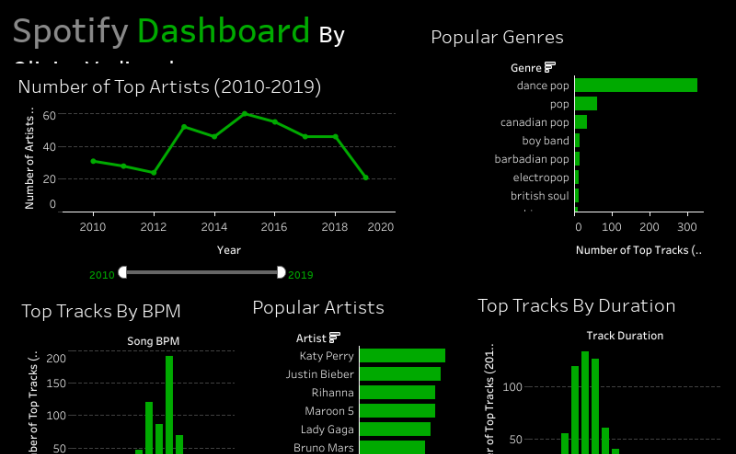
Top Spotify Tracks Data Analysis