CO2 & GHG Emissions Data Analysis
Technologies used: SQL Server (T-SQL), Excel, Power BI
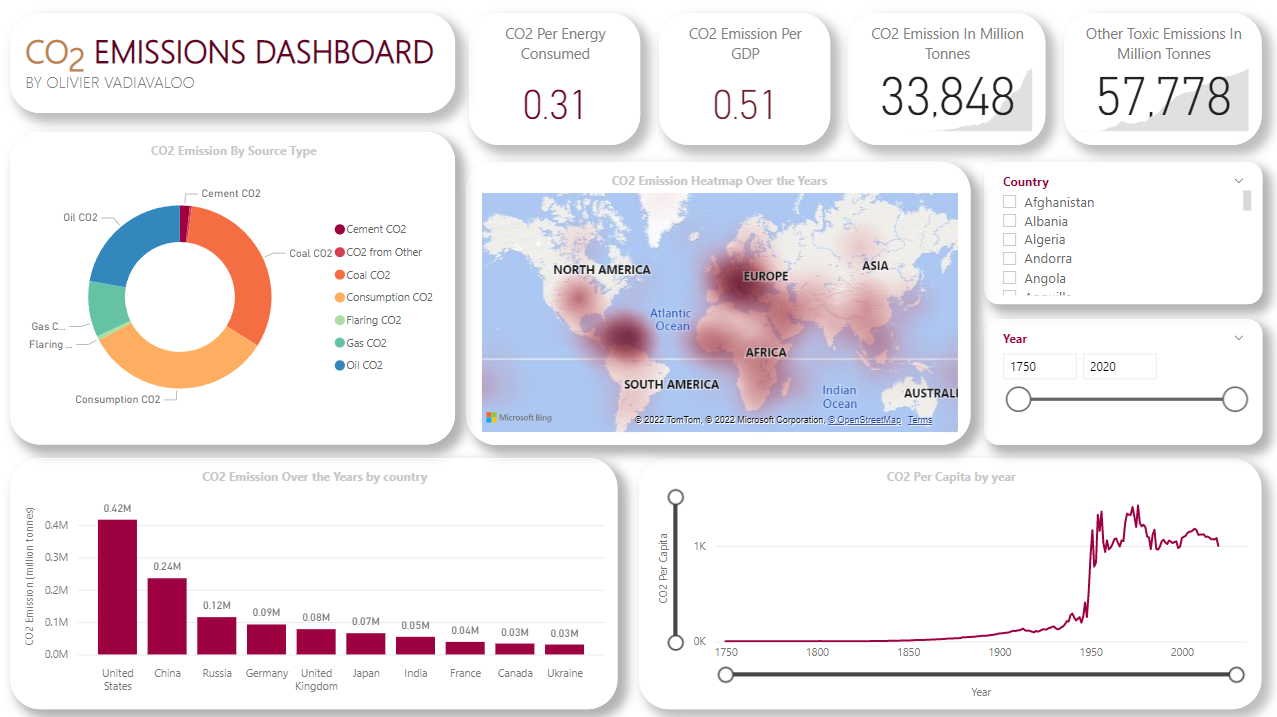
Dashboard File: CO2_Emissions_Dashboard.pbix
Dataset: CO2-Emissions-DB.xlsx
T-SQL Queries: CO2_Emissions_Queries_1.sql
Github: co2-emission-T-SQL
Needless to say that climate change and global warming are major concerns for the world - ever more so today. CO2 and Greenhouse gas emissions - explained very briefly - trap the solar radiation bounced off the Earth's surface, causing the planet to get warmer.
In this project, I cleaned, analyzed and visualized a dataset (source: Our World In Data) about CO2 and Greenhouse Gas (GHG) emissions from every country from 1750 to 2020.
I utilized Microsoft Excel to clean and break down the data into 5 tables:
See the full list of queries here.
Input:
WITH sum_src_emission AS (
SELECT year AS [Year],
	SUM(coal_co2) AS coal_co2,
	SUM(cement_co2) AS cement_co2,
	SUM(flaring_co2) AS flaring_co2,
	SUM(gas_co2) AS gas_co2,
	SUM(oil_co2) AS oil_co2,
	SUM(other_industry_co2) AS other_industry_co2
FROM CO2EmissionsDB..CountryCO2EmissionPerSourceType
GROUP BY [Year]
),
unpivoted_src_emission AS (
	SELECT *
	FROM (
			SELECT *
			FROM sum_src_emission
		) AS a
		UNPIVOT (
			SourceCO2Emission FOR Sources IN (
				coal_co2,
				cement_co2,
				flaring_co2,
				gas_co2,
				oil_co2,
				other_industry_co2
			)
		) AS p
),
emission_group_by_yr_source  AS (
	SELECT Sources,
		MAX(SourceCO2Emission) AS MaxSrcCO2Emission
	FROM unpivoted_src_emission
	GROUP BY Sources
)
SELECT unpivotedTable.[Year],
	unpivotedTable.SourceCO2Emission AS [Source CO2 Emission],
	SUBSTRING(REPLACE(unpivotedTable.Sources, '_', ' '), 1, LEN(unpivotedTable.Sources) - 4) AS [Source]
FROM emission_group_by_yr_source maxEmission
	INNER JOIN unpivoted_src_emission unpivotedTable
	ON maxEmission.Sources = unpivotedTable.Sources AND
	maxEmission.MaxSrcCO2Emission = unpivotedTable.SourceCO2Emission
| Year | Source CO2 Emission (in million tonnes) | Source |
| 2019 | 7562.807 | gas |
| 2019 | 11002.896 | oil |
| 2014 | 15064.781 | coal |
| 2014 | 304.664 | other industry |
| 2020 | 1626.533 | cement |
| 2020 | 436.052 | flaring |
• The most CO2 emission for each source type happened after 2010. 🤔
• Coal had the highest maximum CO2 emission (~15k million tonnes) out of all source types in the
dataset.
Input:
SELECT TOP(10) country AS Country,
	   MAX([co2_per_capita]) AS [CO2 Per Capita]
FROM CO2EmissionsDB..CountriesCO2EmissionsPerYear
WHERE co2 IS NOT NULL AND
	  year = 2011 AND
	  gdp IS NOT NULL
GROUP BY country
ORDER BY [CO2 Per Capita] DESC
Output:
| Country | CO2 Per Capita |
| Qatar | 39.122 |
| Trinidad and Tobago | 34.936 |
| Kuwait | 27.229 |
| Bahrain | 22.272 |
| United Arab Emirates | 21.571 |
| Luxembourg | 21.379 |
| United States | 17.781 |
| Saudi Arabia | 17.605 |
| Canada | 16.499 |
| Oman | 16.448 |
• Recall that Qatar was - and still is at the time of writing - the largest Liquefied Natural Gas (LNG) producer in 2011 and has a fairly small population compared to other countries.
Input:
WITH max_co2_per_country AS (
	SELECT country AS [Country],
			year AS [Year],
			co2 AS CO2,
			MAX(co2) OVER (PARTITION BY country) AS [Max CO2 Emission]
	FROM CO2EmissionsDB..CountriesCO2EmissionsPerYear
	WHERE co2 IS NOT NULL
),
max_co2_per_country2 AS (
	SELECT [Country], [Year], [Max CO2 Emission]
	FROM max_co2_per_country
	WHERE [MAX CO2 Emission] = co2
),
max_co2_shares AS (
	SELECT perCountry.[Country],
			perCountry.[Year],
			perCountry.[Max CO2 Emission],
			perSrc.coal_co2 / perCountry.[Max CO2 Emission] AS [Coal Share],
			perSrc.cement_co2 / perCountry.[Max CO2 Emission] AS [Cement Share],
			perSrc.flaring_co2 / perCountry.[Max CO2 Emission] AS [Flaring Share],
			perSrc.gas_co2 / perCountry.[Max CO2 Emission] AS [Gas Share],
			perSrc.oil_co2 / perCountry.[Max CO2 Emission] AS [Oil Share],
			perSrc.other_industry_co2 / perCountry.[Max CO2 Emission] AS [Other Industry Share]
	FROM max_co2_per_country2 perCountry
			INNER JOIN CO2EmissionsDB..CountryCO2EmissionPerSourceType perSrc
			ON perCountry.[Country] = perSrc.country AND
			perCountry.[Year] = perSrc.year
),
cross_apply_src_shares AS (
	SELECT ms.[Country], ms.[Year], ms.[Max CO2 Emission],
			t.[Source Type], t.[CO2 Emission Share]
	FROM max_co2_shares ms
			CROSS APPLY (
			VALUES
				('coal', ms.[Coal Share]),
				('cement', ms.[Cement Share]),
				('flaring', ms.[Flaring Share]),
				('Gas', ms.[Gas Share]),
				('oil', ms.[Oil Share]),
				('Other Industry', ms.[Other Industry Share])
			) t ([Source Type], [CO2 Emission Share])
)
SELECT c1.[Country], c1.[Year], c1.[Source Type],
	   ROUND(c1.[Max CO2 Emission], 3) AS [Max CO2 Emission],
	   ROUND(c1.[CO2 Emission Share], 3) AS [Source CO2 Emission Share]
FROM cross_apply_src_shares c1
WHERE c1.[CO2 Emission Share] = (
	SELECT MAX(c2.[CO2 Emission Share])
	FROM cross_apply_src_shares c2
	WHERE c1.[Country] = c2.[Country]
)
| Country | Year | Source Type | Max CO2 Emission | Source CO2 Emission Share |
| Afghanistan | 2020 | coal | 12.16 | 0.617 |
| Albania | 1989 | oil | 8.977 | 0.456 |
| Algeria | 2019 | Gas | 166.642 | 0.555 |
| Andorra | 2005 | oil | 0.575 | 1 |
| Angola | 2012 | oil | 33.801 | 0.511 |
| Anguilla | 2015 | oil | 0.154 | 1 |
| Anguilla | 2016 | oil | 0.154 | 1 |
| Antigua and Barbuda | 1969 | oil | 1.257 | 1 |
| Argentina | 2015 | Gas | 192.406 | 0.486 |
| Armenia | 1989 | Gas | 9.523 | 0.485 |
| Aruba | 2007 | oil | 2.821 | 1 |
| Austria | 2005 | oil | 79.068 | 0.498 |
| Azerbaijan | 1992 | oil | 56.174 | 0.556 |
| Bahamas | 1977 | oil | 9.709 | 0.996 |
| Bahrain | 2020 | Gas | 34.96 | 0.882 |
| Bangladesh | 2019 | Gas | 94.215 | 0.639 |
| Barbados | 2008 | oil | 1.612 | 0.889 |
| Belarus | 1986 | oil | 121.013 | 0.778 |
| Belgium | 1979 | oil | 139.787 | 0.485 |
| Belize | 2019 | oil | 0.658 | 0.986 |
| Benin | 2019 | oil | 7.315 | 0.966 |
| Bermuda | 1989 | oil | 0.78 | 1 |
| Bhutan | 2019 | coal | 1.927 | 0.502 |
| Bolivia | 2018 | oil | 23.856 | 0.54 |
| Bonaire Sint Eustatius and Saba | 1976 | oil | 0.939 | 1 |
| Bosnia and Herzegovina | 2019 | coal | 24.847 | 0.776 |
| Botswana | 2018 | coal | 7.561 | 0.612 |
| Brazil | 2014 | oil | 557.901 | 0.639 |
| British Virgin Islands | 2014 | oil | 0.213 | 1 |
| British Virgin Islands | 2015 | oil | 0.213 | 1 |
| British Virgin Islands | 2016 | oil | 0.213 | 1 |
| Brunei | 1949 | oil | 11.468 | 0.898 |
| Bulgaria | 1987 | coal | 91.273 | 0.458 |
| Burkina Faso | 2019 | oil | 4.336 | 0.972 |
| Burundi | 2019 | oil | 0.704 | 0.939 |
| Cambodia | 2019 | oil | 15.329 | 0.487 |
| Cameroon | 2018 | oil | 7.932 | 0.671 |
| Canada | 2007 | oil | 594.665 | 0.448 |
| Cape Verde | 2011 | oil | 0.616 | 1 |
| Central African Republic | 1987 | oil | 0.26 | 1 |
| Chad | 2011 | oil | 1.118 | 1 |
| Chile | 2019 | oil | 86.129 | 0.541 |
| China | 2020 | coal | 10667.887 | 0.696 |
| Christmas Island | 1975 | oil | 0.136 | 1 |
| Colombia | 2016 | oil | 93.242 | 0.488 |
| Comoros | 2019 | oil | 0.306 | 1 |
| Congo | 2016 | oil | 3.702 | 0.597 |
| Cook Islands | 2019 | oil | 0.079 | 1 |
| Cook Islands | 2020 | oil | 0.079 | 1 |
| Costa Rica | 2019 | oil | 8.818 | 0.916 |
| Cote d'Ivoire | 2017 | oil | 11.86 | 0.636 |
| Croatia | 2007 | oil | 24.866 | 0.543 |
| Cuba | 1989 | oil | 35.719 | 0.942 |
| Curacao | 1976 | oil | 17.589 | 1 |
| Cyprus | 2008 | oil | 8.714 | 0.884 |
| Czechia | 1978 | coal | 184.394 | 0.759 |
| Democratic Republic of Congo | 2014 | oil | 4.631 | 0.971 |
| Denmark | 1996 | coal | 74.852 | 0.469 |
| Djibouti | 2013 | oil | 0.557 | 0.894 |
| Dominica | 2007 | oil | 0.183 | 1 |
| Dominican Republic | 2020 | oil | 27.769 | 0.566 |
| Ecuador | 2014 | oil | 43.207 | 0.87 |
| Egypt | 2017 | oil | 250.605 | 0.475 |
| El Salvador | 2019 | oil | 6.853 | 0.943 |
| Equatorial Guinea | 2017 | Gas | 12.285 | 0.501 |
| Eritrea | 1996 | oil | 0.898 | 0.979 |
| Estonia | 1989 | coal | 38.869 | 0.675 |
| Eswatini | 2013 | oil | 1.4 | 0.517 |
| Ethiopia | 2019 | oil | 16.371 | 0.695 |
| Faeroe Islands | 2001 | oil | 0.762 | 1 |
| Fiji | 2020 | oil | 1.393 | 0.961 |
| Finland | 2003 | coal | 72.658 | 0.482 |
| France | 1973 | oil | 537.407 | 0.679 |
| French Equatorial Africa | 1958 | oil | 0.429 | 1 |
| French Guiana | 1993 | oil | 0.859 | 1 |
| French Polynesia | 2020 | oil | 0.828 | 1 |
| French West Africa | 1957 | oil | 1.403 | 0.943 |
| Gabon | 1978 | oil | 7.555 | 0.586 |
| Gambia | 2019 | oil | 0.547 | 0.993 |
| Georgia | 1988 | Gas | 16.315 | 0.502 |
| Germany | 1979 | coal | 1117.888 | 0.491 |
| Ghana | 2019 | oil | 16.918 | 0.699 |
| Greece | 2007 | oil | 114.592 | 0.472 |
| Greenland | 2011 | oil | 0.725 | 1 |
| Grenada | 2019 | oil | 0.332 | 1 |
| Guadeloupe | 2019 | oil | 2.562 | 0.817 |
| Guadeloupe | 2020 | oil | 2.562 | 0.817 |
| Guatemala | 2019 | oil | 21.934 | 0.618 |
| Guinea | 2019 | oil | 3.717 | 1 |
| Guinea-Bissau | 2019 | oil | 0.314 | 1 |
| Guyana | 2019 | oil | 2.487 | 0.935 |
| Haiti | 2018 | oil | 3.368 | 0.977 |
| Honduras | 2019 | oil | 10.789 | 0.929 |
| Hong Kong | 2014 | coal | 45.492 | 0.678 |
| Hungary | 1984 | coal | 90.561 | 0.407 |
| Iceland | 2008 | oil | 3.811 | 0.766 |
| India | 2019 | coal | 2625.968 | 0.639 |
| Indonesia | 2019 | coal | 660.594 | 0.477 |
| Iran | 2020 | Gas | 745.035 | 0.583 |
| Iraq | 2019 | oil | 222.991 | 0.657 |
| Ireland | 2005 | oil | 48.156 | 0.535 |
| Israel | 2012 | oil | 74.785 | 0.47 |
| Italy | 2005 | oil | 502.26 | 0.477 |
| Jamaica | 2006 | oil | 11.577 | 0.967 |
| Japan | 2013 | oil | 1315.343 | 0.412 |
| Jordan | 2014 | oil | 25.895 | 0.866 |
| Kazakhstan | 2018 | coal | 317.28 | 0.552 |
| Kenya | 2019 | oil | 18.347 | 0.796 |
| Kiribati | 2019 | oil | 0.068 | 1 |
| Kiribati | 2020 | oil | 0.068 | 1 |
| Kuwait | 2016 | oil | 100.859 | 0.551 |
| Kyrgyzstan | 1985 | oil | 22.564 | 0.43 |
| Laos | 2019 | coal | 33.932 | 0.862 |
| Latvia | 1985 | oil | 25.687 | 0.714 |
| Lebanon | 2017 | oil | 27.977 | 0.892 |
| Leeward Islands | 1955 | oil | 0.033 | 0.879 |
| Leeward Islands | 1956 | oil | 0.033 | 0.879 |
| Lesotho | 2012 | coal | 3.092 | 0.808 |
| Liberia | 1980 | oil | 2.038 | 0.976 |
| Libya | 2014 | oil | 71.39 | 0.579 |
| Liechtenstein | 2006 | oil | 0.231 | 0.684 |
| Lithuania | 1985 | oil | 40.311 | 0.686 |
| Luxembourg | 1974 | coal | 14.424 | 0.64 |
| Macao | 2015 | oil | 2.028 | 0.885 |
| Madagascar | 2018 | oil | 4.167 | 0.624 |
| Malawi | 2019 | oil | 1.588 | 0.819 |
| Malaysia | 2019 | oil | 278.659 | 0.313 |
| Maldives | 2020 | oil | 1.796 | 1 |
| Mali | 2019 | oil | 3.688 | 0.931 |
| Malta | 2003 | oil | 2.979 | 1 |
| Marshall Islands | 2019 | oil | 0.151 | 1 |
| Marshall Islands | 2020 | oil | 0.151 | 1 |
| Martinique | 2005 | oil | 2.441 | 1 |
| Mauritania | 2019 | oil | 3.698 | 1 |
| Mauritius | 2017 | oil | 4.536 | 0.607 |
| Mayotte | 2019 | oil | 0.306 | 1 |
| Mayotte | 2020 | oil | 0.306 | 1 |
| Mexico | 2012 | oil | 496.3 | 0.585 |
| Micronesia (country) | 2020 | oil | 0.148 | 1 |
| Moldova | 1985 | oil | 41.765 | 0.599 |
| Mongolia | 2019 | coal | 88.691 | 0.946 |
| Montenegro | 2019 | coal | 2.645 | 0.625 |
| Montserrat | 2010 | oil | 0.062 | 1 |
| Morocco | 2019 | oil | 68.217 | 0.534 |
| Mozambique | 2017 | oil | 8.323 | 0.712 |
| Myanmar | 2020 | oil | 36.326 | 0.545 |
| Namibia | 2017 | oil | 4.216 | 0.883 |
| Nauru | 1986 | oil | 0.161 | 1 |
| Nepal | 2019 | oil | 16.967 | 0.429 |
| Netherlands | 1979 | oil | 187.007 | 0.479 |
| New Caledonia | 2019 | coal | 8.706 | 0.665 |
| New Zealand | 2008 | oil | 37.713 | 0.5 |
| Nicaragua | 2019 | oil | 5.673 | 0.938 |
| Niger | 2014 | oil | 2.075 | 0.809 |
| Nigeria | 2019 | oil | 130.104 | 0.528 |
| Niue | 2014 | oil | 0.011 | 1 |
| Niue | 2018 | oil | 0.011 | 1 |
| Niue | 2019 | oil | 0.011 | 1 |
| Niue | 2020 | oil | 0.011 | 1 |
| North Korea | 1989 | coal | 213.072 | 0.902 |
| North Macedonia | 1988 | coal | 14.383 | 0.596 |
| Norway | 2007 | oil | 45.714 | 0.534 |
| Oceania | 2019 | coal | 471.189 | 0.373 |
| Oman | 2017 | Gas | 65.906 | 0.721 |
| Pakistan | 2018 | oil | 238.306 | 0.42 |
| Palau | 2007 | oil | 0.253 | 1 |
| Palestine | 2017 | oil | 3.268 | 1 |
| Panama | 2019 | oil | 12.294 | 0.794 |
| Papua New Guinea | 2020 | oil | 6.652 | 0.848 |
| Paraguay | 2019 | oil | 8.525 | 0.951 |
| Peru | 2010 | oil | 57.173 | 0.406 |
| Philippines | 2019 | coal | 146.615 | 0.473 |
| Poland | 1987 | coal | 463.733 | 0.851 |
| Portugal | 2002 | oil | 69.749 | 0.621 |
| Puerto Rico | 1920 | oil | 0.209 | 1 |
| Qatar | 2019 | Gas | 115.037 | 0.822 |
| Reunion | 2019 | oil | 4.588 | 0.541 |
| Reunion | 2020 | oil | 4.588 | 0.541 |
| Romania | 1989 | coal | 213.599 | 0.391 |
| Russia | 1990 | oil | 2525.518 | 0.352 |
| Rwanda | 2019 | oil | 1.187 | 0.837 |
| Ryukyu Islands | 1972 | oil | 9.005 | 0.986 |
| Saint Helena | 2016 | oil | 0.015 | 1 |
| Saint Kitts and Nevis | 2018 | oil | 0.245 | 1 |
| Saint Lucia | 2018 | oil | 0.509 | 1 |
| Saint Pierre and Miquelon | 1989 | oil | 0.103 | 1 |
| Saint Pierre and Miquelon | 1991 | oil | 0.103 | 1 |
| Saint Vincent and the Grenadines | 2009 | oil | 0.278 | 1 |
| Samoa | 2020 | oil | 0.246 | 1 |
| Sao Tome and Principe | 2018 | oil | 0.132 | 1 |
| Saudi Arabia | 2015 | oil | 674.878 | 0.615 |
| Senegal | 2018 | oil | 11.33 | 0.614 |
| Serbia | 2006 | coal | 60.838 | 0.659 |
| Seychelles | 2019 | oil | 0.581 | 1 |
| Sierra Leone | 2014 | oil | 1.11 | 1 |
| Singapore | 2009 | oil | 90.098 | 0.848 |
| Sint Maarten (Dutch part) | 1976 | oil | 2.098 | 1 |
| Slovakia | 1990 | coal | 61.475 | 0.547 |
| Slovenia | 2008 | oil | 18.25 | 0.481 |
| Solomon Islands | 2013 | oil | 0.374 | 1 |
| Somalia | 1988 | oil | 1.004 | 0.978 |
| South Africa | 2009 | coal | 502.259 | 0.822 |
| South Korea | 2018 | coal | 671.631 | 0.507 |
| South Sudan | 2015 | oil | 1.913 | 1 |
| Spain | 2005 | oil | 369.681 | 0.512 |
| Sri Lanka | 2017 | oil | 23.03 | 0.705 |
| St. Kitts-Nevis-Anguilla | 1980 | oil | 0.051 | 1 |
| Sudan | 2019 | oil | 22.031 | 0.929 |
| Suriname | 2014 | oil | 2.809 | 0.986 |
| Sweden | 1970 | oil | 92.287 | 0.902 |
| Switzerland | 1973 | oil | 46.203 | 0.904 |
| Syria | 2008 | oil | 66.877 | 0.791 |
| Taiwan | 2017 | coal | 284.812 | 0.577 |
| Tajikistan | 1985 | oil | 13.107 | 0.594 |
| Tanzania | 2019 | oil | 12.043 | 0.602 |
| Thailand | 2013 | oil | 287.598 | 0.417 |
| Timor | 2014 | oil | 0.608 | 0.844 |
| Togo | 2009 | oil | 2.741 | 0.801 |
| Tonga | 2017 | oil | 0.158 | 1 |
| Trinidad and Tobago | 2010 | Gas | 46.957 | 0.895 |
| Tunisia | 2019 | oil | 30.011 | 0.46 |
| Turkey | 2017 | coal | 425.329 | 0.371 |
| Turkmenistan | 2019 | Gas | 76.319 | 0.711 |
| Turks and Caicos Islands | 2018 | oil | 0.234 | 1 |
| Tuvalu | 1990 | oil | 0.011 | 1 |
| Tuvalu | 1995 | oil | 0.011 | 1 |
| Tuvalu | 1998 | oil | 0.011 | 1 |
| Tuvalu | 2001 | oil | 0.011 | 1 |
| Tuvalu | 2002 | oil | 0.011 | 1 |
| Tuvalu | 2003 | oil | 0.011 | 1 |
| Tuvalu | 2004 | oil | 0.011 | 1 |
| Tuvalu | 2006 | oil | 0.011 | 1 |
| Tuvalu | 2007 | oil | 0.011 | 1 |
| Tuvalu | 2008 | oil | 0.011 | 1 |
| Tuvalu | 2009 | oil | 0.011 | 1 |
| Tuvalu | 2010 | oil | 0.011 | 1 |
| Tuvalu | 2011 | oil | 0.011 | 1 |
| Tuvalu | 2012 | oil | 0.011 | 1 |
| Tuvalu | 2013 | oil | 0.011 | 1 |
| Uganda | 2019 | oil | 5.721 | 0.935 |
| Ukraine | 1985 | coal | 742.189 | 0.5 |
| United Arab Emirates | 2015 | Gas | 216.583 | 0.619 |
| United Kingdom | 1971 | coal | 660.388 | 0.517 |
| United States | 2005 | oil | 6134.521 | 0.425 |
| Uruguay | 2012 | oil | 8.592 | 0.947 |
| Uzbekistan | 2002 | Gas | 127.518 | 0.8 |
| Vanuatu | 2020 | oil | 0.182 | 1 |
| Venezuela | 2013 | oil | 207.425 | 0.618 |
| Vietnam | 2019 | coal | 260.312 | 0.476 |
| Wallis and Futuna | 2005 | oil | 0.029 | 1 |
| Wallis and Futuna | 2006 | oil | 0.029 | 1 |
| Wallis and Futuna | 2007 | oil | 0.029 | 1 |
| Wallis and Futuna | 2009 | oil | 0.029 | 1 |
| Wallis and Futuna | 2010 | oil | 0.029 | 1 |
| Yemen | 2013 | oil | 24.976 | 0.854 |
| Zambia | 2018 | oil | 7.313 | 0.479 |
| Zimbabwe | 1994 | coal | 17.394 | 0.779 |
• At a glance, it seems most countries' major source of CO2 emission is oil-related. 🤔
Hannah Ritchie, Max Roser and Pablo Rosado (2020) - "CO₂ and Greenhouse Gas Emissions". Published online at OurWorldInData.org. Retrieved from: 'https://ourworldindata.org/co2- and-other-greenhouse-gas-emissions' [Online Resource]
I generally reply to email inquiries within 3-5 business days. The best time to reach me by phone is between 11am and 5pm during weekdays. Feel free to leave a message on my voicemail if I'm temporarily unreachable via phone call.
CO2 & GHG Emissions Data Analysis

Indeed Job Web Scraping

Fictional Bike Sales Data Analysis

Top Spotify Tracks Data Analysis